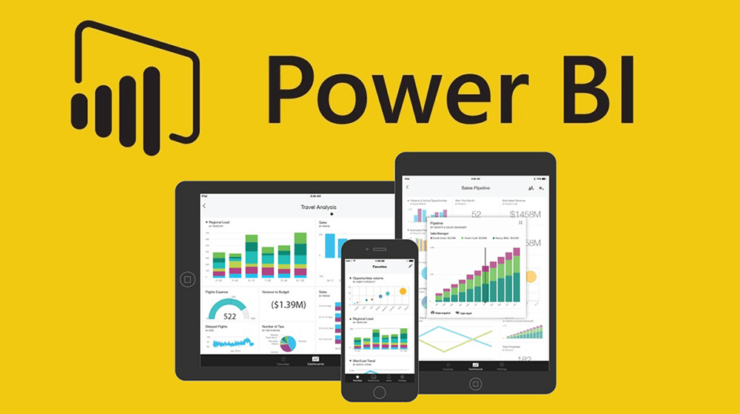
Microsoft Power BI is a technology-driven business intelligence application that analyses and visualizes raw data to offer actionable insights. It blends business analytics, data visualization, and best practices to assist businesses in making data-driven choices. Because of the features of the Power BI platform, Gartner named Microsoft the leader in the “2019 Gartner Magic Quadrant for Analytics and Business Intelligence Platform” in February 2019.
What Exactly is Power BI?
Microsoft Power BI is a business analytics solution that allows you to view data and share findings. It transforms data from several sources to create interactive dashboards and business intelligence reports.
We have some sales data on an Excel sheet, as you can see above. Power BI helps you in creating graphs and various charts to visualize the data.
Now that you know what Power BI is, let’s look at why it’s necessary.
Users of Power BI Desktop can:
- Connect to the data
- Data transformation and modelling
- Make charts and graphs.
- Build reports and dashboards that are visual collections.
- Use the Power BI service to share reports with others.
Power BI Professional
Power BI Pro is a cloud-based programme that costs $10 per user per month. The ability to communicate with other Power BI users and deliver reports and visualizations to other Power BI subscribers.
Users of Power BI Pro can:
- Power BI visuals may be included in Power BI apps.
- Connect to other Microsoft technologies, such as Azure data services.
- Dashboards, Data, and reports may be shared with other Power BI users.
- Establish workspaces—areas for you and your coworkers to collaborate on dashboards and reports.
- Allow peer-to-peer sharing, which allows you to share published dashboards or reports with people who don’t work for you but have a Power BI Pro licence.
The Architecture of Power BI

The Power BI architecture is an Azure-based solution. Power BI can connect to a variety of data sources. You may use Power BI Desktop to produce reports and data visualisations based on the dataset. To obtain continuous data for reporting and analytics, the Power BI gateway is linked to on-premise data sources. The cloud services used to publish Power BI reports and data visualisations are referred to as “Power BI services.” You can access their data from anywhere by using the Power BI mobile apps.Apps for Power BI are available for Windows, iOS, and Android.
Service for Power BI
The Power BI service is Power BI’s Software as a Service (SaaS). Power BI Online is another name for it. You must first log in to the Power BI Service in order to access it.
It enables you to connect to data, produce reports and dashboards, and query your data.
Now that you understand what Power BI is, its architecture, and its services, let us look at dashboards in Power BI.
7 Benefits of Using Power BI
How do you determine if Microsoft Power BI is suitable for your company? Here are seven reasons to use Power BI—and one reason why you should use something else:
- A fast start. With a simple setup, no training required, and dashboards for services such as Salesforce, Google Analytics, and Microsoft Dynamics, you’ll be able to gain insights rapidly.
- Publication and dissemination have been streamlined. Instead of emailing or saving reports and visualisations to a shared disc, analysts submit them to the Power BI service, and their data is refreshed whenever the underlying dataset changes.
- Information that is updated in real time. Dashboards change in real time as data is sent or streamed in, allowing viewers to solve issues and uncover opportunities in real time. Each report or dashboard may display and update real-time data and graphics. Factory sensors, social media sources, and anything else that captures or sends time-sensitive data are examples of streaming data sources.
- Customize the Power BI app navigation. An “app navigation experiences” feature allows report producers to personalise navigation to assist users in rapidly finding material and understanding the links between different reports and dashboards.
- Customization of security features Row-level security (RLS) access filters can be used by report developers to guarantee that users see only data that is relevant to them, reducing the danger of individuals accessing material they shouldn’t.
- Integration of Cortana. Power BI integrates with Cortana, Microsoft’s digital assistant. Users can get charts and graphs by asking natural-language inquiries. This is very useful for mobile device users.
- AI stands for “artificial intelligence.” Users of Power BI may leverage image recognition and text analytics, build machine learning models, and connect to Azure Machine Learning.
So, why would you pass up Power BI? The online Power BI service, including Pro and Premium, is available from any web browser; however, the Power BI Desktop application is not available for Linux or Mac. Microsoft Power BI Desktop may not be suitable if you work in a Mac-only environment.
Power BI features
The following are some of Power BI’s features:
Desktop version of Power BI
Power BI Desktop is free software that you can download and install to create reports by conveniently accessing data. You do not require complex report design or query expertise to create a report using Power BI Desktop.
Flow Analytics
The key benefit of Power BI is its capabilities for stream analytics. Power BI supports real-time analytics to make fast choices, from manufacturing sensors to social media sources.
Many data sources
One of Power BI’s most important features is its support for diverse data sources. Data from Excel, CSV, SQL Server, Web files, and other sources can be used to create interactive visualisations.
Demand Visualization
When working with complicated data, Power BI’s default setting may not be sufficient in some circumstances. In that situation, you can use the custom visualisation library to satisfy your demands.
To further understand what Power BI is and how it may assist, see a case study of how Meijer, one of the largest grocery chains in the United States, used Power BI to solve business challenges.
Conclusion
After reading this article, you should have a better understanding of the importance of Power BI in business intelligence, what it is, and the many capabilities of Power BI. You also learned about Power BI Service, how to construct a Power BI dashboard, and how the architecture looks. Lastly, you investigated the many aspects of Power BI Desktop by generating several visuals to evaluate finance sample data.